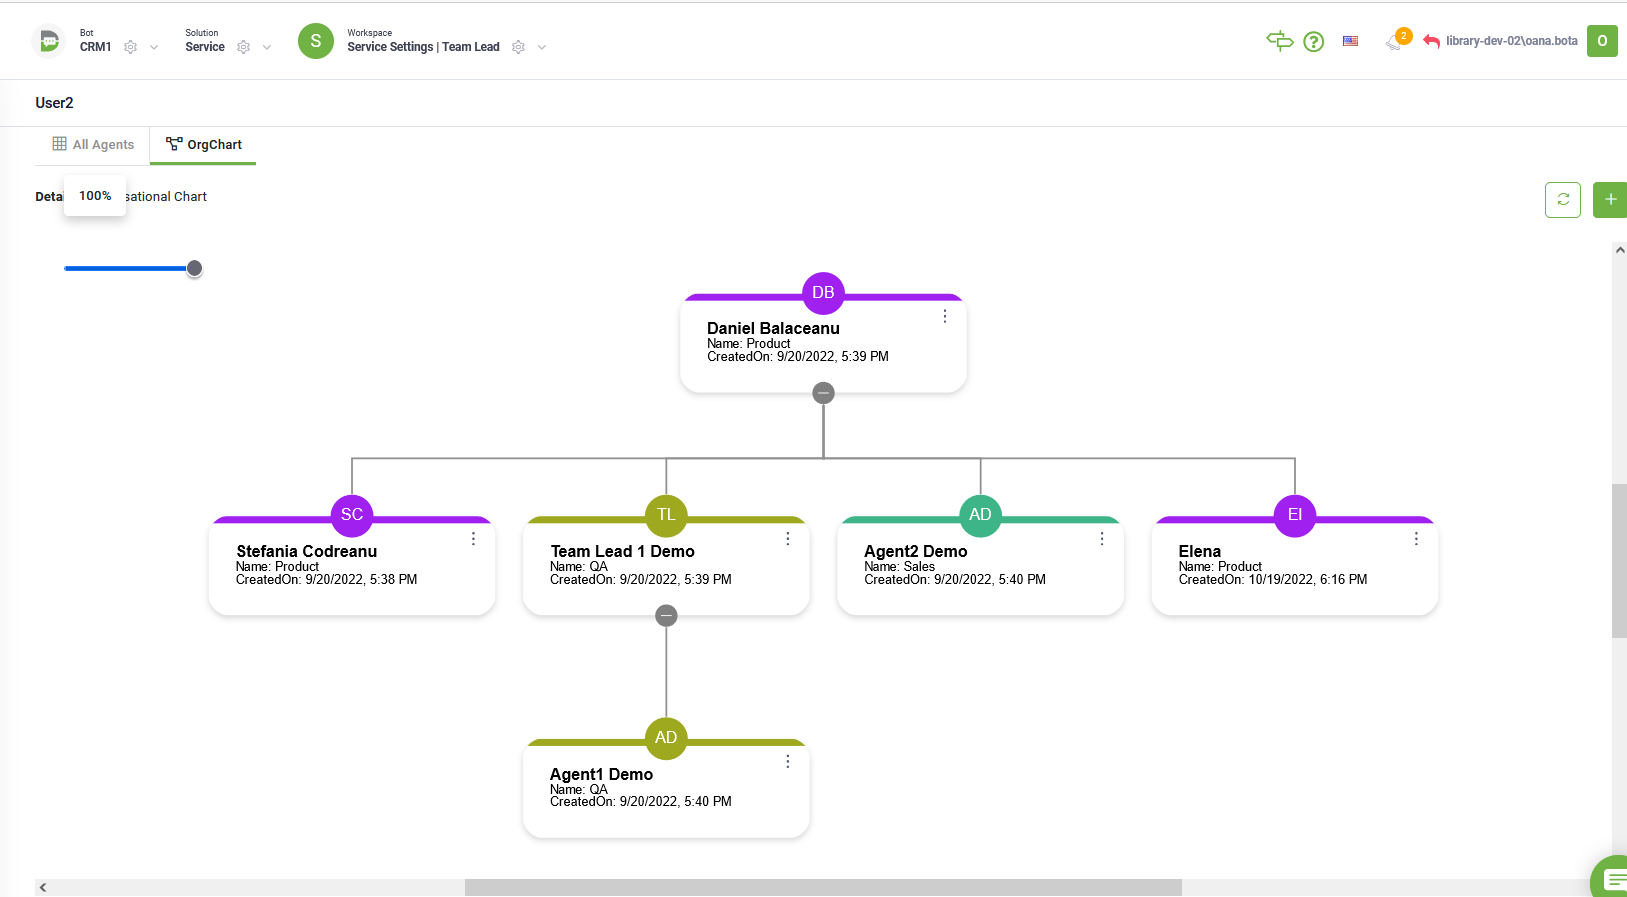
Organizational Charts
Organizational charts display data in a hierarchical tree structure, typically reading from top to bottom. They represent parent-child relationships, helping visualize the hierarchy within an organization.
Setting Up an Organizational Chart
To set up an organization chart, follow these steps:
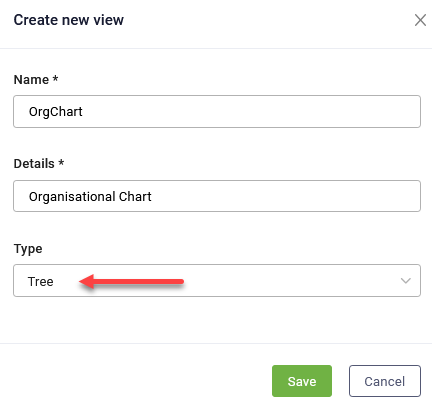
Step 1. Create a Tree view
Before creating an organizational chart, you must first add a Tree view to the desired entity.
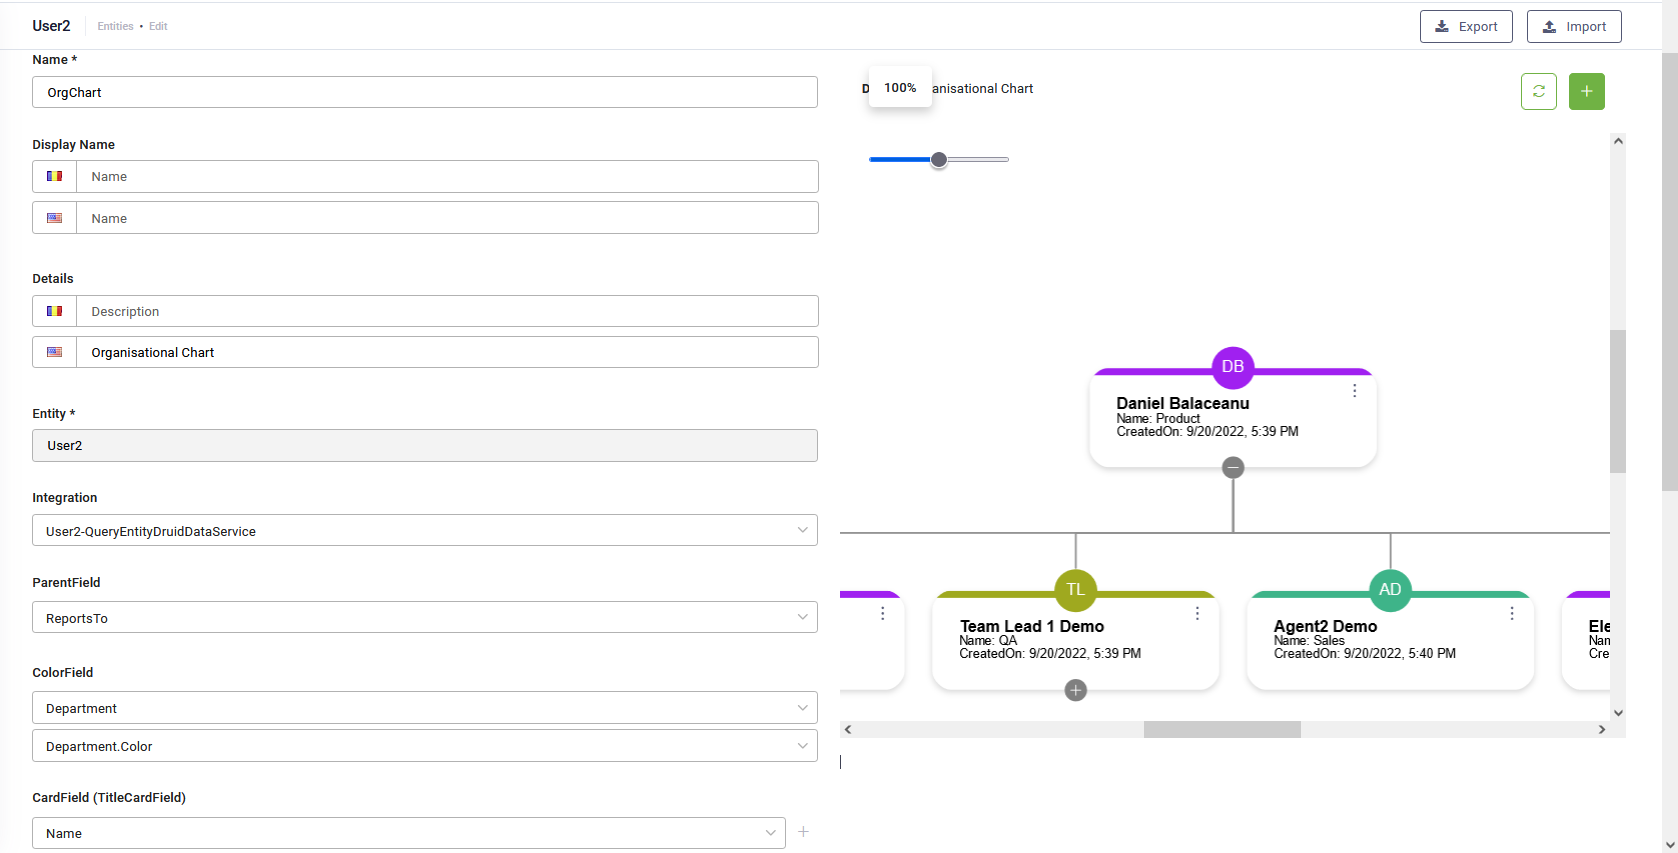
Step 2. Define the organizational chart
On the entity’s Views page, click the name of the view you created in Step 1. The Tree View General Configuration page will appear, showing the configuration settings on the left and a chart preview on the right.
Define the view properties by setting the parameters described in the table below.
| Parameter | Description | Mandatory |
|---|---|---|
| Name | The view name. Displays the name you provided when creating the view, but you can update it here. | Yes |
| Display Name | If the view contains multilingual records, provide the Display name and Details in all the AI Agent supported languages. Business users will see the name in their language. | No |
| Details | No | |
| Integration | Select a DRUID Data Service query entity integration from the list of available integrations. This integration will pull all the entity’s data. | Yes |
| Parent field | Choose the field that defines the parent-child relationship in the hierarchy. | Yes |
| Color field | Select the field that stores the color values for the tree cards. The top of the tree cards will be colored accordingly. | No |
| Title card field |
Choose the entity field that will display the card’s title in the chart. |
Yes |
| Card fields | Click the + icon next to the Title Card Field and select additional entity fields to display more information on the chart cards. | No |
Step 3: Save the Configuration
Once you’ve defined the view properties, click the Save icon ( ) at the top-right corner of the editor.
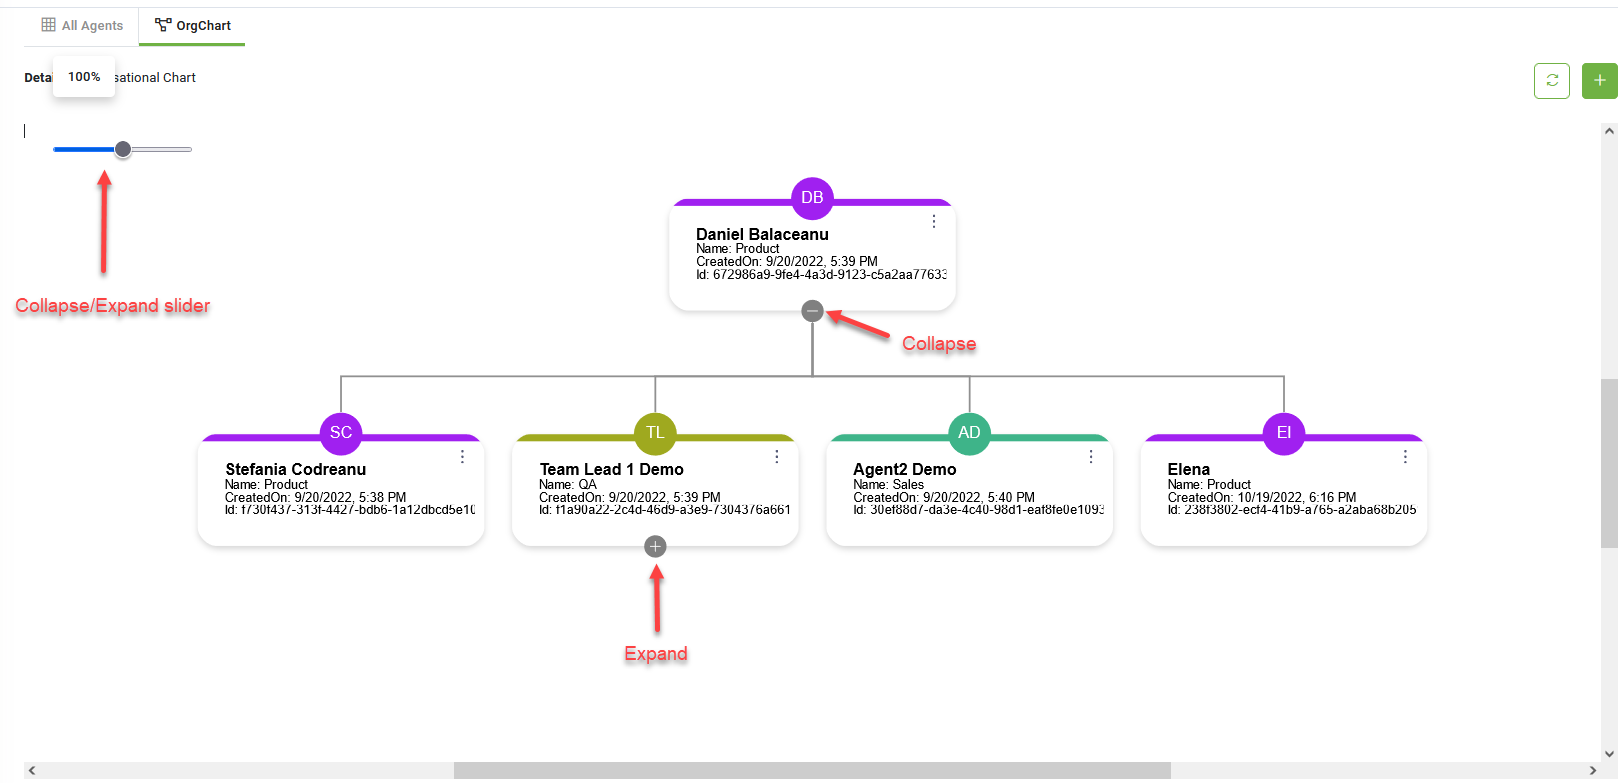
Use the Collapse/Expand Feature
In the preview area on chart configuration and in workspaces, use the Collapse/Expand slider or the +/- icons in the chart to collapse or expand the organizational chart, helping you manage the view of complex hierarchies.